Observability as a Service: Transforming How Businesses Monitor Their Systems

Audio : Listen to This Blog.
Hey there, tech enthusiasts! Have you ever had that sinking feeling when you realize your application has gone down in the middle of the night? You scramble to check logs, monitor dashboards and send hurried messages to your team while clutching your coffee cup for dear life. I’ve been there, too, and it’s not pretty. Imagine being alerted to potential issues before they become critical, all while sipping your coffee in peace. Enter: Observability as a Service (OaaS).
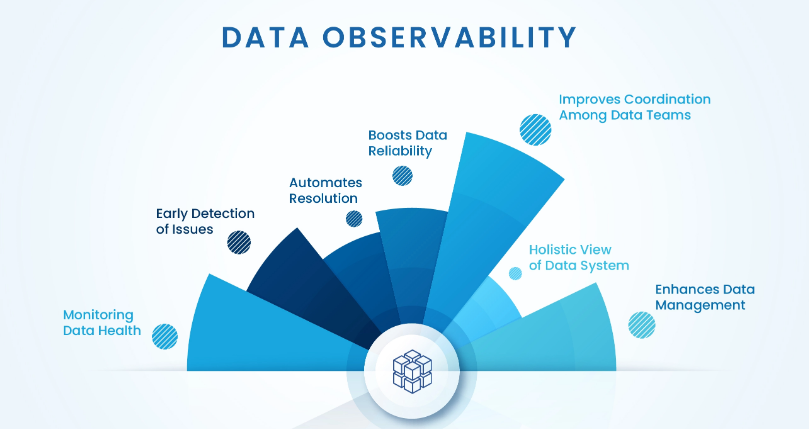
Observability as a Service rapidly transforms how businesses monitor their systems, ensuring that applications run smoothly and efficiently. Unlike traditional monitoring tools, OaaS provides comprehensive observability and monitoring, offering end-to-end visibility and telemetry data. This blog will dive deep into what OaaS is, why it’s essential, and how it can benefit your organization. We’ll also explore secondary keywords like “cloud observability,” “full-stack monitoring,” and “metrics collection” to provide a comprehensive understanding of this game-changing service.
What is Observability as a Service?
At its core, Observability as a Service (OaaS) involves leveraging cloud-based solutions to monitor and analyze the performance of applications, infrastructure, and networks in real time. Rooted in control theory, observability helps in understanding and improving the performance of distributed IT systems by using telemetry data (metrics, logs, and traces) to provide deep visibility and root cause analysis. Unlike traditional monitoring tools, which often focus on specific metrics or logs, OaaS provides a holistic view of a system’s health by integrating data from multiple sources.
Key Components of OaaS:

Observability as a Service (OaaS) hinges on three core components: metrics, logs, and traces. Understanding these elements is crucial for grasping how OaaS delivers comprehensive insights into system performance. Telemetry data, which includes metrics, logs, and traces, is used in OaaS to provide comprehensive insights by enabling deep visibility into distributed systems and improving system performance. Let’s break down each component and see how they contribute to the observability landscape.
1. Metrics
Metrics are numerical data that quantifies system behavior and performance. They provide a high-level overview of your system’s health by measuring CPU usage, memory consumption, request rates, and error counts. By monitoring these metrics, you can quickly identify trends and anomalies that may indicate underlying issues, enabling you to take proactive measures to maintain optimal performance.
2. Logs
Logs are detailed records of events that occur within an application or infrastructure. They capture information about system activities, including user actions, errors, and system state changes. By analyzing logs, you can pinpoint the exact sequence of events leading up to an issue, making diagnosing and resolving problems easier. Logs are indispensable for troubleshooting and understanding the root cause of incidents.
3. Traces
Traces provide detailed paths that requests take through a system, offering insights into latency and performance bottlenecks. Each trace represents the journey of a single request as it traverses various services and components. By examining traces, you can identify slow or failing parts of your system, understand dependencies, and optimize the flow of requests. Traces are particularly valuable in distributed systems, where issues can arise from complex interactions between different services.
Why is Observability as a Service Essential?
In today’s digital age, businesses rely heavily on complex, distributed systems to deliver customer services. Any downtime or performance degradation can lead to lost revenue, damaged reputation, and frustrated users. Here’s why OaaS is crucial: OaaS contributes significantly to maintaining system health by providing comprehensive insights and root-cause exploration.
Enhanced Visibility Across Distributed Systems
With microservices architectures becoming the norm, applications are more distributed than ever. OaaS (Observability as a Service) provides full-stack monitoring by integrating various tools and technologies such as distributed tracing (e.g., Jaeger, Zipkin), log aggregation (e.g., ELK Stack, Fluentd), and real-time dashboards (e.g., Grafana, Kibana).
These tools allow businesses to see every system component, from the front end to the back end and everything in between. This level of visibility, aided by service mesh technologies like Istio and Linkerd, is essential for identifying and resolving issues quickly, ensuring seamless operation across different services.
Proactive Issue Detection and Resolution
Traditional monitoring tools often react to issues after they’ve occurred. In contrast, OaaS leverages advanced analytics and machine learning for anomaly detection and predictive maintenance. It detects anomalies and potential issues before they impact users by utilizing AI-driven insights through tools like TensorFlow and automated root cause analysis with platforms like Dynatrace.
Self-healing capabilities using orchestration tools like Kubernetes and Docker automatically resolve identified problems. This proactive approach, supported by integration with incident management platforms such as PagerDuty and Opsgenie, allows businesses to address problems before they escalate, ensuring continuous uptime and optimal performance.
Scalability and Flexibility
As businesses grow, their monitoring needs evolve. OaaS solutions are designed to scale with your organization, leveraging container orchestration tools like Kubernetes and service mesh technologies such as Istio. Whether you’re monitoring a handful of services or thousands of microservices spread across multiple cloud environments, OaaS solutions support scalability through auto-scaling and dynamic resource allocation.
Infrastructure as code (IaC) tools like Terraform and Ansible also help manage complex environments efficiently. This flexibility ensures that you always have the right level of observability, no matter how complex your system becomes.
How Observability as a Service Works
Observability as a Service (OaaS) simplifies the complex task of monitoring, analyzing, and visualizing the health and performance of IT systems. By leveraging cloud-based solutions, OaaS offers businesses comprehensive insights into their infrastructure and applications without requiring extensive in-house resources. These services collect data and aggregate logs, metrics, and traces from various sources, provide real-time analytics and alerts, and offer powerful visualization tools to help teams quickly identify and resolve issues.
Telemetry Data Collection and Aggregation
At the core of OaaS is data collection and aggregation. This involves continuously gathering logs, metrics, and traces from diverse sources such as servers, databases, applications, and network devices. The collected data is then normalized and stored in a central repository, making conducting analysis and generating reports easier. This process ensures that all relevant information is accessible and ready for real-time insights.
Real-Time Analytics and Alerting

Once data is collected and aggregated, OaaS platforms leverage advanced analytics to provide real-time insights. These analytics can detect anomalies, identify trends, and predict potential issues before they become critical. Real-time alerting ensures that IT teams are promptly notified of any abnormalities, allowing for swift intervention. Customizable alert thresholds and automated response actions further enhance the effectiveness of incident management.
Visualization and Dashboards
Visualization tools are vital to OaaS, transforming raw data and external outputs into interactive and easy-to-understand dashboards. These dashboards allow teams to monitor system performance, track key metrics, and gain actionable insights at a glance. With customizable views and the ability to drill down into specific data points, users can quickly identify and address issues, improving operational efficiency and reducing downtime.
Leading OaaS Providers
The Observability as a Service market is growing, with several leading providers offering robust solutions through their observability platforms. Companies like Datadog, New Relic, Splunk, Dynatrace, and Grafana Labs are at the forefront, each bringing unique strengths and features to their platforms. These providers cater to various business needs, from small startups to large enterprises, ensuring scalable and flexible observability solutions.
Several key players stand out for their unique strengths and offerings in the realm of monitoring and observability platforms. Each platform brings a distinct set of features that cater to different industry needs, from comprehensive monitoring to specialized machine data analysis. Here is an expanded look at some of the leading solutions in this space.
Datadog is celebrated for its all-encompassing monitoring and security platform, which offers robust integrations and real-time observability across diverse environments. This platform supports a wide range of technologies, enabling seamless integration with existing systems and providing a holistic view of the infrastructure. With capabilities such as metrics, traces, and logs in one unified platform, Datadog empowers businesses to detect and resolve issues promptly, ensuring operational efficiency and enhanced security posture.
New Relic stands out as a full-stack observability tool, emphasizing application performance monitoring and customer experience insights. The platform provides comprehensive visibility into the entire software stack, from the underlying infrastructure to the end-user experience, allowing for thorough performance analysis and optimization. Organizations can deliver superior digital experiences and maintain high application reliability by leveraging New Relic’s advanced analytics and user-centric approach.
Splunk specializes in analyzing machine data, offering powerful tools for log management and operational intelligence. Its robust platform allows for real-time monitoring and deep insights into system behaviors, making IT operations, security, and business analytics indispensable. Splunk’s ability to process massive volumes of data and uncover actionable intelligence enables organizations to make informed decisions and respond swiftly to emerging threats and opportunities.
Dynatrace excels with its AI-powered observability, which includes automated root cause analysis and precise anomaly detection. This platform leverages artificial intelligence to monitor complex, dynamic environments and automatically identify the root causes of performance issues. The proactive nature of Dynatrace’s technology ensures that companies can preemptively address problems before they impact users, resulting in higher uptime and better overall system performance.
Grafana Labs is highly regarded for its open-source visualization capabilities, particularly in creating customizable dashboards and alerting systems. Grafana’s flexible and extensible platform allows users to visualize and analyze data from various sources, tailoring dashboards to meet specific needs. This level of customization, combined with a strong community and extensive plugin ecosystem, makes Grafana a go-to solution for teams seeking to build sophisticated monitoring systems and gain deep insights into their data.
How OaaS Benefits Your Organization
Implementing Observability as a Service can provide numerous benefits to your organization. Let’s delve into some of the most significant advantages:
OaaS helps create an observable system by analyzing external outputs to provide holistic insights, explore root causes of issues, discover unknown patterns, and enable adaptability and optimization in dynamic IT environments.
Improved Mean Time to Resolution (MTTR)

When an issue occurs, the clock starts ticking. The longer it takes to resolve the problem, the more significant the impact on your business. OaaS reduces MTTR by providing real-time insights into system performance, enabling your team to identify the root cause and implement a fix quickly. With detailed traces and logs at your fingertips, you’ll spend less time troubleshooting and more time delivering value to your customers.
Optimized Resource Utilization
Resources like CPU, memory, and storage are finite; inefficient use of these resources can lead to performance bottlenecks and increased costs. OaaS helps you optimize resource utilization by providing insights into how your applications and infrastructure are performing. Identifying underutilized resources and addressing inefficiencies can reduce costs and ensure your systems run at peak performance.
Enhanced Security and Compliance

Security breaches can have devastating consequences for businesses, both financially and reputationally. OaaS includes robust security features that help you detect and respond to potential threats in real time. By monitoring logs and metrics for unusual activity, you can identify and mitigate security risks before they compromise your system. Additionally, OaaS solutions often include compliance reporting features, making it easier to meet regulatory requirements.
Seamless Integration with DevOps Practices
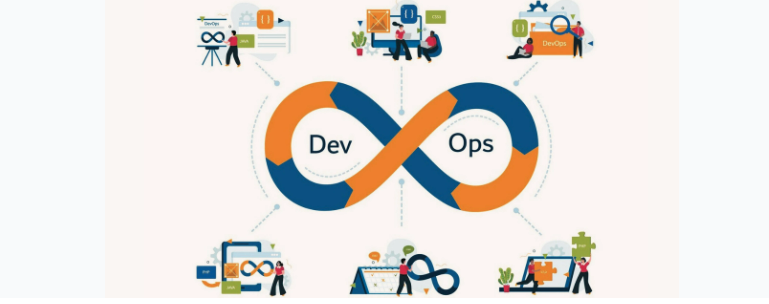
Source: Futurecode
DevOps practices emphasize collaboration, automation, and continuous improvement. OaaS aligns perfectly with these principles by providing the data and insights to make informed decisions. Integrating OaaS into your DevOps workflow can enhance collaboration between development and operations teams, automate monitoring and alerting processes, and continuously improve your systems’ performance and reliability.
Implementing Observability as a Service
Now that we’ve covered the what and why of OaaS, let’s explore how you can implement it within your organization. Here are some key steps to get started:
1. Define Your Observability Goals

Before implementing OaaS, it’s essential to define your observability goals. What do you want to achieve? Are you looking to reduce MTTR, optimize resource utilization, enhance security, or improve overall system performance? Setting clear goals allows you to choose the right OaaS solution and tailor it to meet your needs.
2. Choose the Right OaaS Provider
Numerous OaaS providers are in the market, each offering different features and capabilities. When selecting a provider, consider scalability, ease of use, integration capabilities, and cost. Look for a provider that aligns with your observability goals and allows you to grow with your organization.
3. Implement Comprehensive Monitoring
To achieve comprehensive observability, monitoring all aspects of your system, including applications, infrastructure, and networks, is crucial. Implement monitoring agents and collectors across your environment to gather data from multiple sources. Ensure your OaaS solution integrates with your existing monitoring tools and platforms.
4. Leverage Advanced Analytics and Machine Learning

Advanced analytics and machine learning are at the heart of OaaS. These technologies enable you to gain deeper insights into your system’s behavior and detect anomalies that may indicate potential issues. Utilize these capabilities to identify and resolve problems before they impact your users proactively.
5. Foster a Culture of Observability
Implementing OaaS is not just about technology; it’s also about culture. Encourage your team to embrace observability as an integral part of their workflow. Foster a culture of continuous monitoring, feedback, and improvement. By prioritizing observability, you can ensure your systems are always running at their best.
The Future of Observability as a Service
As technology continues to evolve, so too will the capabilities of Observability as a Service. Here are some trends to watch for in the future:
1. AI-Powered Observability
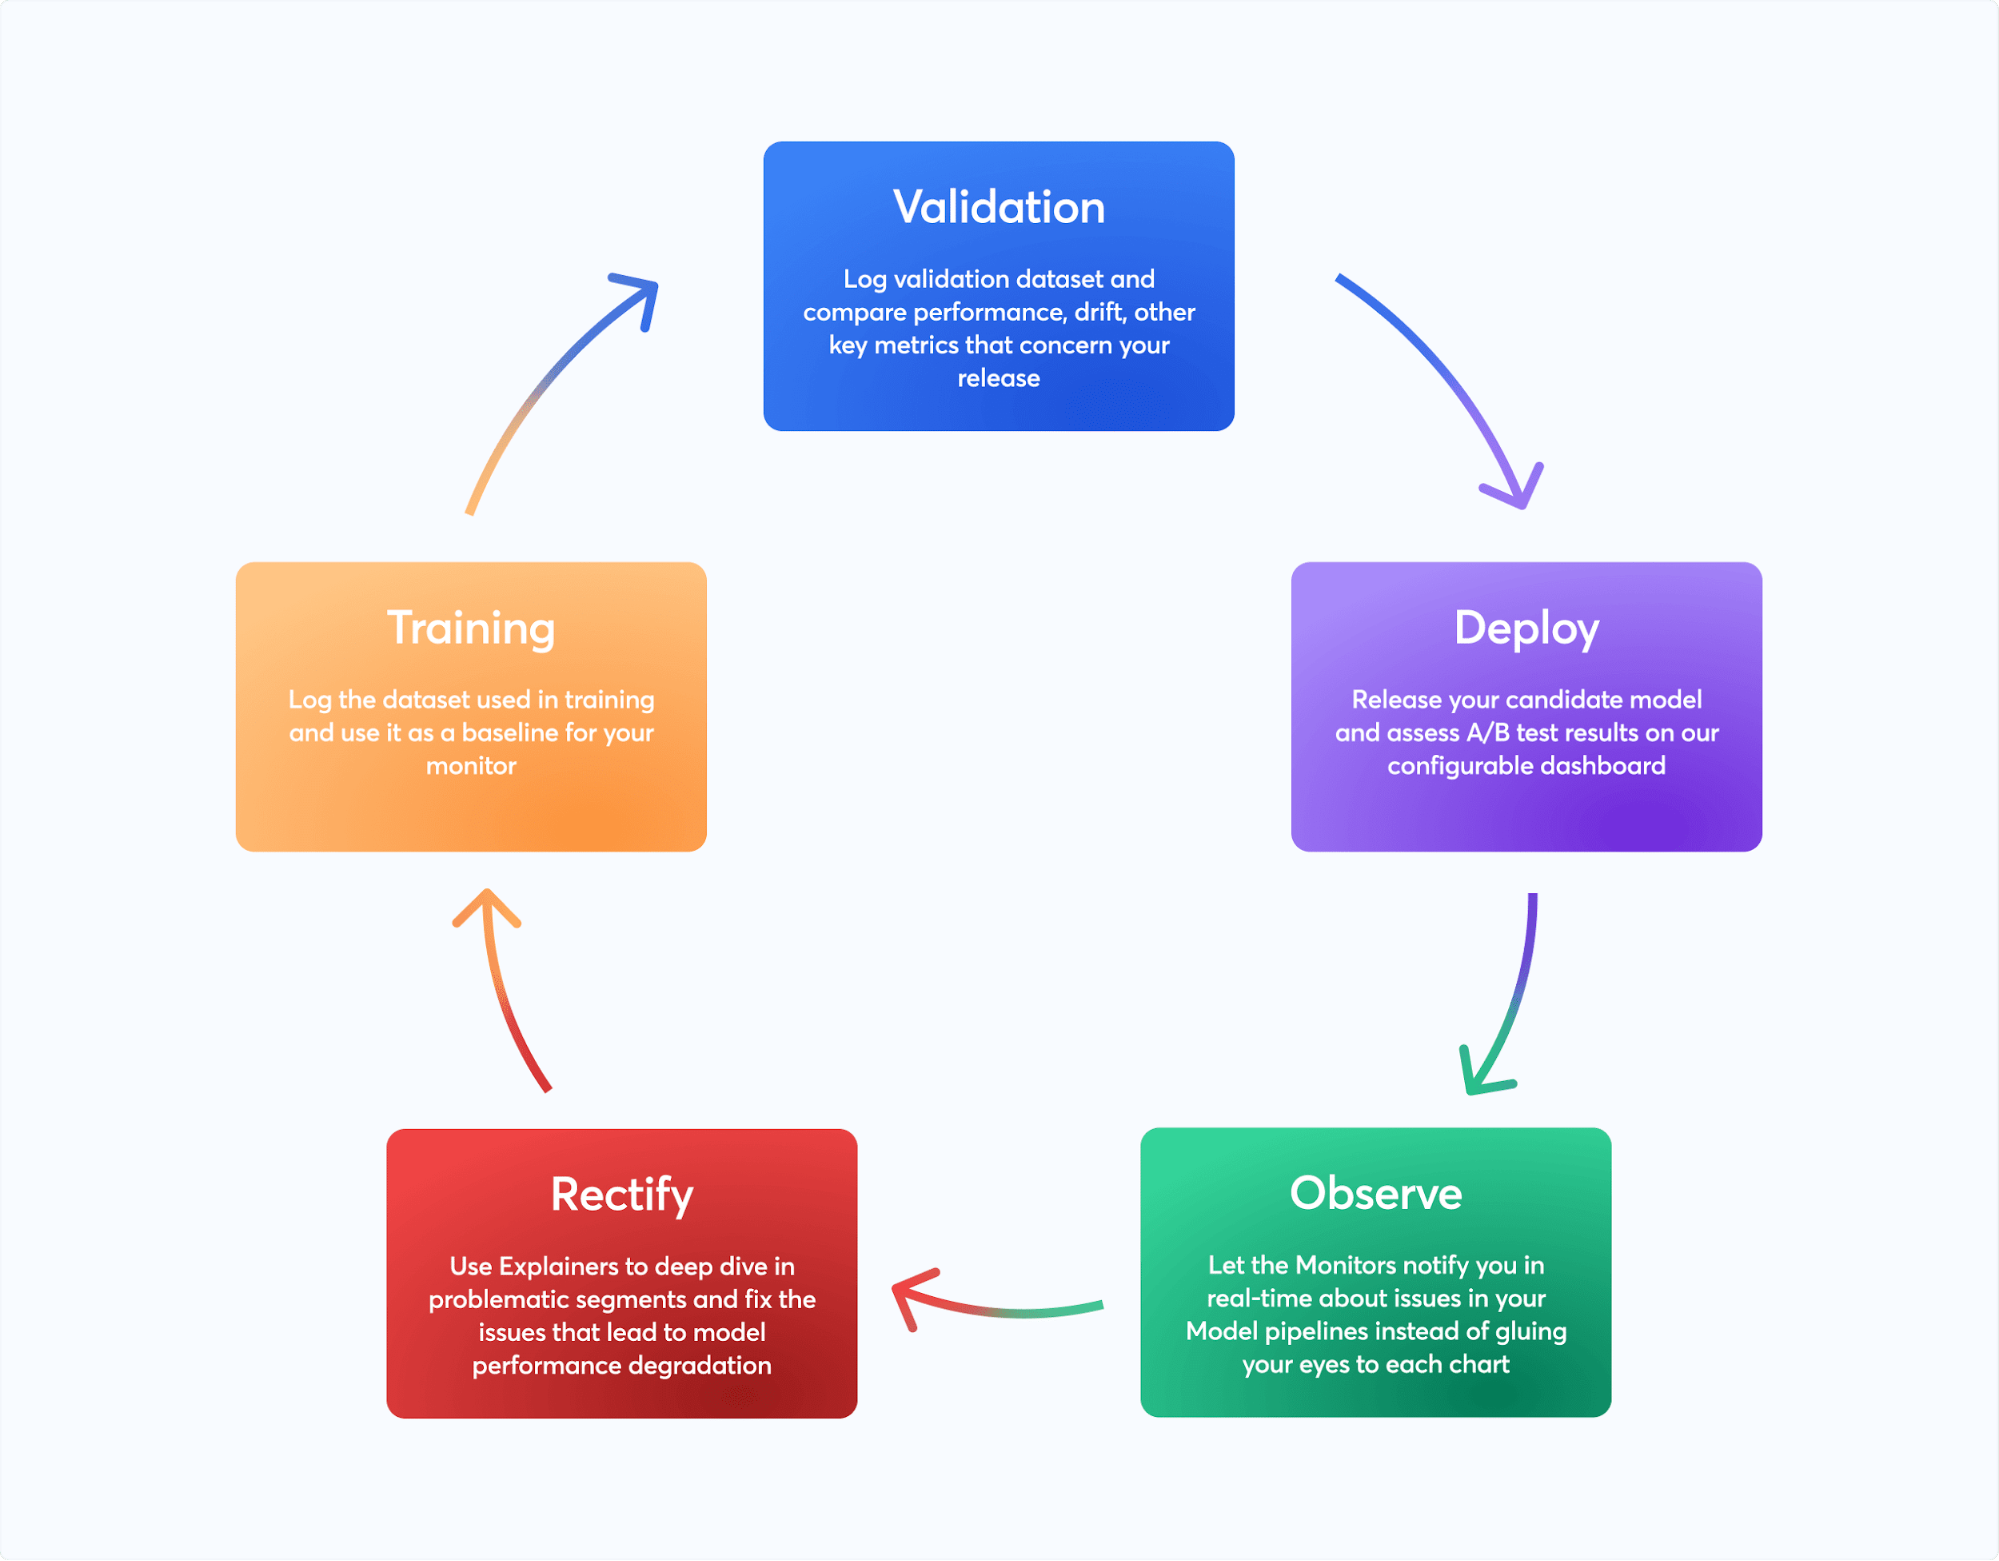
Source: Censius
Artificial intelligence and machine learning will play an increasingly significant role in OaaS. These technologies will enable even more advanced analytics, allowing businesses to gain deeper insights into their systems and automate the detection and resolution of issues. By leveraging AI, companies can predict potential system failures before they happen, thereby minimizing downtime.
AI-driven observability can help understand complex system behaviors by correlating data across different sources. This ultimately leads to a more resilient and responsive IT infrastructure.
2. Unified Observability Platforms
The future of OaaS lies in unified observability platforms that integrate monitoring, logging, and tracing into a single solution. These platforms will provide a seamless user experience, making it easier for businesses to achieve comprehensive observability across their entire environment. Organizations can reduce operational complexity and costs by consolidating disparate tools into one platform.
Furthermore, a unified approach enhances collaboration across DevOps teams, streamlining workflows and improving overall efficiency. These platforms will also offer advanced visualization tools, helping stakeholders better understand system performance and health.
3. Observability for Edge Computing
As edge computing becomes more prevalent, the need for observability at the edge will grow. OaaS solutions will evolve to support the unique requirements of edge environments, enabling businesses to monitor and manage their distributed systems effectively. This includes providing real-time insights into device performance and network latency, which is critical for maintaining optimal operation.
Edge observability will also facilitate quicker identification and resolution of issues specific to localized environments. Moreover, these solutions will ensure consistent data collection and analysis, even in scenarios with intermittent connectivity.
4. Enhanced Security and Compliance Features

With cyber threats increasing in frequency, OaaS providers will continue to enhance their security and compliance features. Businesses can expect more robust threat detection and response capabilities and improved compliance reporting to meet regulatory requirements. Enhanced encryption methods and access controls will become standard to protect sensitive data.
Automated compliance checks and audits will help organizations stay ahead of regulatory changes without extensive manual effort. As a result, companies can maintain high-security standards while focusing on their core business objectives.
Conclusion

Observability as a Service transforms how businesses monitor their systems, providing enhanced visibility, proactive issue detection, and optimized performance. By implementing OaaS, organizations can reduce downtime, maximize resource utilization, enhance security, and improve overall system reliability. As technology continues to evolve, the future of OaaS promises even more advanced capabilities, making it an indispensable tool for businesses in the digital age.
So, rest easy knowing that OaaS has your back next time you sip your coffee. Cheers to a more observable and reliable future! Do you have any questions or need further insights on Observability as a Service?
FAQs

Q: What are observability tools?
A: Observability tools are software solutions designed to provide insights into how applications and systems are performing. These tools collect, analyze, and visualize data from logs, metrics, and traces to help identify performance issues and understand the underlying causes of system behavior.
Q: What is an observability platform?
A: An observability platform is an integrated suite of tools and services that provide a holistic view of an organization’s IT infrastructure. It combines monitoring, logging, tracing, and visualization capabilities in a single solution, enabling seamless correlation of data across different layers of the stack.
Q: What is a distributed system?
A: A distributed system is a network of independent computers that work together to achieve a common goal. Distributed system share resources, communicate through a network, and often appear as a single cohesive unit to users.
Q: What defines complex systems in IT?
A: Complex systems in IT are characterized by multiple interconnected components that interact in unpredictable or non-linear ways. These systems often exhibit emergent behavior, where the overall system’s behavior cannot be easily inferred from the behavior of individual parts.