Unlocking the Power of Splunk Observability: Features and Benefits


Audio : Listen to This Blog.
Alright, let’s face it. Things can get a little… chaotic in the IT and business operations. Picture this: You’re in the middle of a high-stakes poker game, the table is piled high with chips, and suddenly, a cat jumps onto the table, scattering everything. That’s kind of what it feels like trying to manage and monitor complex environments without the right tools.
Enter Splunk Observability, the perfect recipe to save the day and restore order.
Understanding Splunk Observability Cloud: A Comprehensive Overview
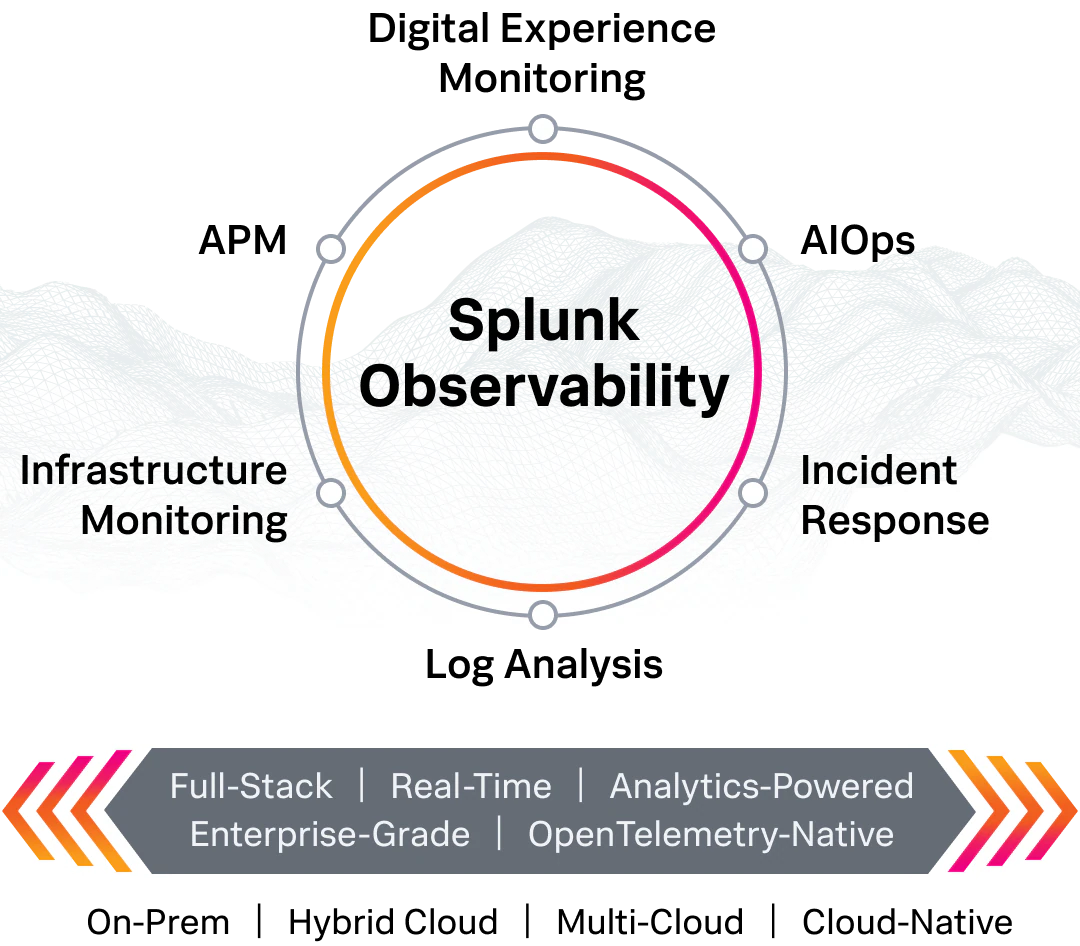
Source: Splunk
Splunk Observability is a powerful suite of tools designed to give you comprehensive insights into your entire IT infrastructure. By integrating observability tools, you can reduce downtime, accelerate insight into operational performance, and achieve more significant ROI. It combines metrics, logs, and traces to provide a complete view of your systems’ performance and health. This isn’t just another monitoring tool; it’s like having a crystal ball that helps you predict issues before they become full-blown disasters.
Core Components of Splunk Observability: Metrics, Logs, and Traces
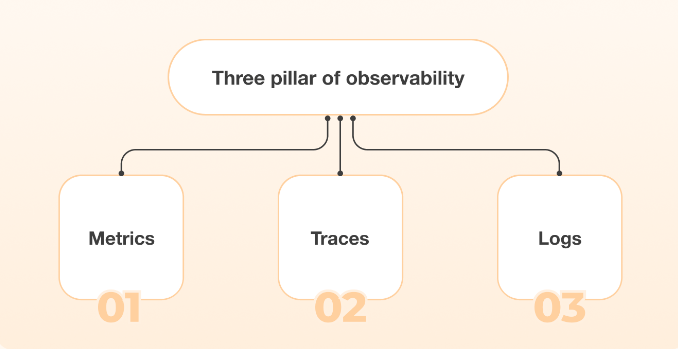
Source: Splunk Observability
Understanding Splunk Observability’s core components is essential to unlocking its power. Infrastructure monitoring is crucial as it provides real-time visibility and analytics for hybrid and multi-cloud environments. It offers proactive monitoring to reduce downtime, improve reliability, and troubleshoot performance issues. These components work together seamlessly to provide a holistic view of your IT environment.
Metrics: The Backbone of System Performance Monitoring with Telemetry Data
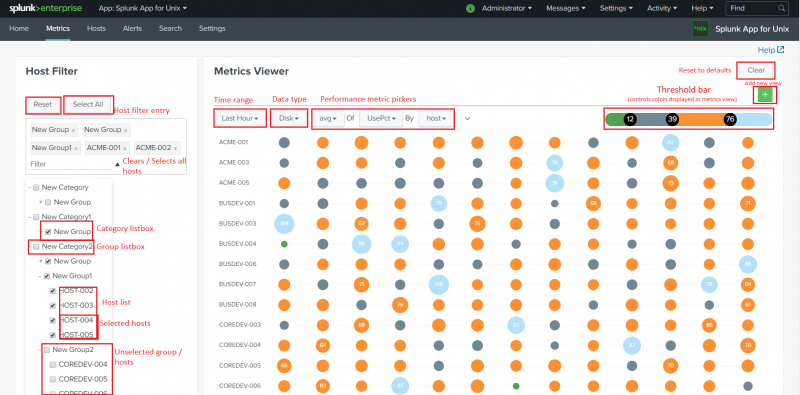
Source: Splunk
Metrics are the foundation of any observability platform. They provide quantitative data about your system’s performance, such as CPU usage, memory consumption, and network latency. Splunk Observability collects and analyzes metrics in real-time, giving you instant insights into the health of your infrastructure.
Logs: Unveiling the Detailed Records of Your Systems
Logs are detailed records of events that occur within your systems. They offer a granular view of what’s happening under the hood. With Splunk Observability, you can aggregate and analyze logs from various sources, making it easier to identify and troubleshoot issues.
The Log Observer feature within Splunk Observability Cloud allows users to explore and analyze logs for troubleshooting, root-cause analysis, and cross-team collaboration.
Traces: Mapping the Journey of Every Request
Traces are like the DNA of your application’s transactions. They provide a step-by-step record of how requests flow through your system. By analyzing traces, you can pinpoint bottlenecks and optimize performance. Splunk Observability’s tracing capabilities allow you to understand the journey of every request, ensuring a smooth user experience.
The Transformative Benefits of Splunk Observability
Now that we’ve covered the basics, let’s explore the benefits of using Splunk Observability. Splunk Observability helps address performance issues by monitoring real-time performance, detecting anomalies, and proactively eliminating customer-facing issues to deliver better digital experiences. Spoiler alert: there are quite a few!
Enhanced Visibility: Seeing is Believing
With Splunk Observability, you gain unparalleled visibility into your entire IT ecosystem. By implementing observability, you can detect anomalies and potential issues before they impact your users. Think of it as having a CCTV camera for your IT infrastructure but without the creepy surveillance vibes.
Proactive Monitoring: Stay Ahead of the Game
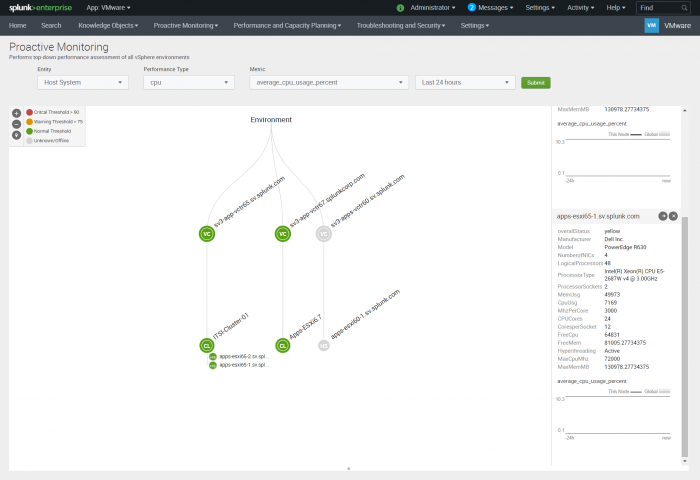
Source: Splunk
Gone are the days of reactive firefighting. Splunk Observability enables proactive monitoring, meaning you can identify and address issues before they escalate. This proactive approach saves time, reduces downtime, and makes users happy. Plus, it gives you more time to enjoy that much-needed coffee break.
Faster Troubleshooting: Be the Hero of the Day
When things go wrong (and let’s be honest, they will), Splunk Observability steps up to the plate. Splunk APM provides full-fidelity application performance monitoring and troubleshooting for cloud-native and microservices-based applications and real-user and synthetic monitoring for end-user experience insight. Its powerful analytics capabilities help you quickly diagnose and resolve issues. Instead of spending hours sifting through logs and metrics, you can pinpoint the root cause in minutes. It’s like having a detective on speed dial, minus the trench coat.
Scalability: Grow Without Worry

As your business grows, so does your IT infrastructure. Splunk Infrastructure Monitoring provides real-time, full-stack visibility across all environment layers, supporting various integrations and offering capabilities like streaming analytics, pre-built dashboards, and intelligent problem detection. Splunk Observability scales effortlessly with your needs, ensuring you always have the right tools to monitor and manage your systems. Whether you’re a startup or a global enterprise, Splunk Observability has got your back.
Improved Collaboration: Teamwork Makes the Dream Work
In large organizations, effective collaboration between teams is crucial. Splunk Observability promotes collaboration by providing a single source of truth for your IT data. This shared visibility fosters teamwork and ensures everyone is on the same page. It’s like a virtual high-five for your DevOps team.
Standout Features of Splunk Observability
To truly appreciate the power of Splunk Observability, let’s take a closer look at some of its standout features. Splunk Observability Solutions integrate seamlessly with AWS services to streamline workflow for DevOps teams, automating tasks such as log aggregation, metric collection, and event correlation. These features set it apart from traditional monitoring tools and make it an indispensable asset for any IT team.
Real-Time Analytics: Act on Insights Instantly

Splunk Observability excels in real-time analytics, allowing you to monitor your systems as events unfold. This capability, enhanced by streaming analytics, is particularly valuable for providing real-time visibility, intelligent problem detection, and alerting for enterprise DevOps teams to meet or exceed Service Level Objectives (SLOs) by quickly detecting, triaging, and resolving performance issues. Imagine being able to spot a lag in real time and fix it before anyone even notices. It’s like magic but with more debugging.
AI-Powered Insights: The Future is Here
Artificial intelligence is no longer the stuff of sci-fi movies. Splunk Observability leverages AI to provide actionable insights and predictions. Analyzing historical data and identifying patterns can predict future issues and recommend proactive measures. It’s like having a fortune-teller for your IT infrastructure but without the crystal ball.
Custom Dashboards: Tailor Your View
Every IT environment is unique, and Splunk Observability recognizes that. It allows you to create custom dashboards tailored to your specific needs. Whether you want to monitor application performance, track user activity, or monitor resource utilization, you can design dashboards that provide the exact information you need. It’s like building your control center with all the bells and whistles.
Alerting and Incident Response: Never Miss a Beat
When issues arise, timely alerts are crucial. Splunk Observability also offers synthetic monitoring to measure the performance of web-based properties synthetically, helping to optimize uptime, performance of APIs, service endpoints, and end user experiences to prevent web performance issues. Splunk Observability allows you to set up customizable alerts based on predefined thresholds and conditions. These alerts can be sent via email, SMS, or integrated with your preferred incident response tools. With Splunk Observability, you’ll never miss a critical event again. It’s like having a watchdog that barks only when something’s genuinely wrong.
Splunk Observability vs. Traditional Monitoring: A Comparative Analysis
You might wonder, “Why should I choose Splunk Observability over traditional monitoring tools?” Well, let me break it down for you.
Holistic View: Traditional monitoring tools often focus on specific aspects of your IT environment, such as metrics or logs. On the other hand, Splunk Observability provides a holistic view by combining metrics, logs, and traces. This comprehensive approach gives you a more accurate picture of your systems’ health and performance.
Proactive Approach: Traditional monitoring tools are often reactive, alerting you after an issue has occurred. Splunk Observability takes a proactive approach, enabling you to identify and address potential problems before they impact your users. This proactive stance reduces downtime and improves overall system reliability.
Scalability and Flexibility: Traditional monitoring tools may struggle to scale with your growing IT infrastructure. Splunk Observability is designed to handle the complexity of modern, dynamic environments. It scales effortlessly, ensuring you always have the right tools to monitor and manage your systems, no matter how large or complex they become.
Advanced Analytics: Traditional monitoring tools often lack the advanced analytics capabilities to gain deep insights into your systems. Splunk Observability leverages AI and machine learning to provide actionable insights and predictions. This level of intelligence allows you to make informed decisions and optimize your IT operations.
Conclusion

Splunk Observability is a robust and versatile tool for managing modern IT environments. Integrating metrics, logs, and traces offers a comprehensive view of your infrastructure, enabling proactive monitoring and faster troubleshooting. The platform’s scalability ensures it grows with your business, maintaining efficiency and reliability as your IT landscape evolves. Enhanced collaboration and custom dashboards further empower teams, making Splunk Observability an invaluable asset for startups and large enterprises.
Moreover, the standout features of real-time analytics, AI-powered insights, and seamless integrations position Splunk Observability ahead of traditional monitoring tools. It transforms how IT operations are managed by identifying issues in real time and predicting potential problems before they occur.