What is Full Stack Observability? Understanding Its Importance in Today’s Digital Landscape


Audio : Listen to This Blog.
Ensuring application performance, reliability, and security has become paramount in the rapidly evolving digital landscape. As organizations invest in IT budgets to accelerate pandemic-era digital transformation, the need for full stack observability becomes increasingly relevant. This necessity has given rise to the concept of full stack observability. But what is full stack observability? In essence, it refers to the comprehensive monitoring and analysis of every component within an application’s stack—from the frontend user interface to the backend infrastructure and everything in between. This article delves into the critical aspects of full stack observability, its significance, and how it can be a game-changer for organizations.
Defining Full Stack Observability
Full stack observability is an advanced approach that provides end-to-end visibility into the performance and health of an entire application stack. It encompasses monitoring all layers, including the application, database, server, network, and underlying infrastructure. By leveraging a blend of metrics, logs, and traces (often referred to as the three pillars of observability), organizations can gain a holistic view of their systems, enabling proactive detection and resolution of issues before they impact end users. A full stack observability solution ensures comprehensive monitoring and analysis of the entire application stack, facilitating real-time insights and shifting from a reactive to a proactive IT culture.
Key Components of Full Stack Observability
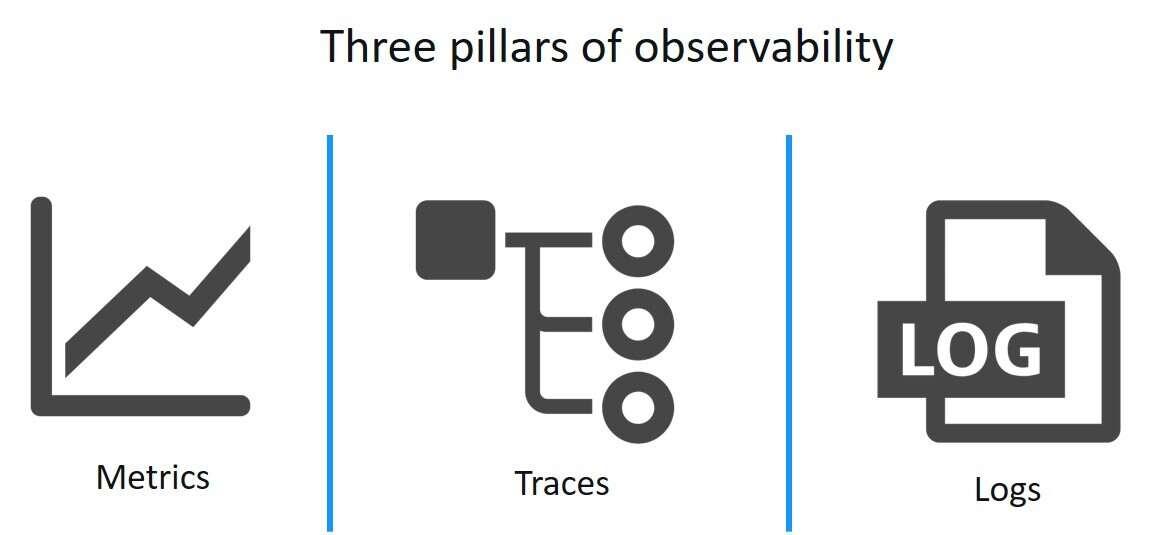
Source: Dynatrace
Metrics are quantitative data points that track the performance of various system components over time. Common examples include CPU usage, memory consumption, and request latency. Metrics provide a quick snapshot of system health. They enable teams to monitor trends and detect anomalies that might indicate performance degradation. By analyzing metrics, organizations can make data-driven decisions to optimize system efficiency.
Logs are detailed records of events that occur within an application. They are invaluable for debugging and troubleshooting specific issues. Logs can show errors, warnings, and informational messages. They offer contextual information that helps understand the sequence of events leading up to an issue. Proper log management can significantly reduce incidents’ mean time to resolution (MTTR).
Tracing involves following a request’s journey through different parts of the system. It shows the interaction between components and helps identify bottlenecks or failures. Traces provide a granular view of requests propagating through various services and databases. This visibility is crucial for pinpointing where performance issues originate, enabling more effective troubleshooting and optimization efforts. Telemetry data is essential in providing in-depth insights into the performance and behavior of applications and infrastructure, especially in a distributed IT environment.
The Importance of Full Stack Observability and End-to-End Visibility
Understanding what full stack observability entails is crucial, but recognizing its importance is even more vital. With the increasing complexity of modern applications, traditional monitoring tools often fall short of providing the necessary insights. Full stack observability helps correlate performance metrics with business outcomes, ensuring that every aspect of the tech stack contributes to the organization’s overall success. Here’s why full stack observability is indispensable in today’s digital age:
Full stack observability provides a comprehensive view of your IT environment, from infrastructure to applications. It leverages data correlation to offer deeper insights, enabling proactive and predictive visibility across IT infrastructures and services. This holistic approach ensures that potential issues are identified and resolved before they impact end-users, maintaining the quality and reliability of software delivery.
Enhanced Performance Monitoring

Modern applications use microservices architectures, distributed systems, and cloud-native technologies. Microservices architectures utilize application programming interfaces (APIs) to facilitate service communication. This complexity makes pinpointing performance issues challenging. Full stack observability allows teams to monitor the performance of every stack layer, ensuring that no part goes unchecked. For instance, slow database queries or inefficient code paths can be identified and optimized, improving overall application performance.
Proactive Issue Resolution and Root Cause Analysis
One of the primary benefits of full stack observability is its ability to detect potential issues before they escalate into major problems. By continuously monitoring metrics, logs, and traces, teams can spot anomalies and trends that indicate underlying issues. This proactive approach enables quicker resolution times, reducing downtime and improving user experience.
Improved Collaboration and Efficiency
Full stack observability fosters collaboration among development, operations, and security teams. Aligning IT and business teams helps prioritize business goals and explore revenue-generating opportunities. With a unified view of the application stack, teams can collaborate more effectively to diagnose and resolve issues. Eliminating operational silos is crucial to improving cross-functional collaboration. This shared visibility breaks down silos and ensures that everyone is on the same page, leading to improved efficiency and faster incident response times.
Implementing Full Stack Observability
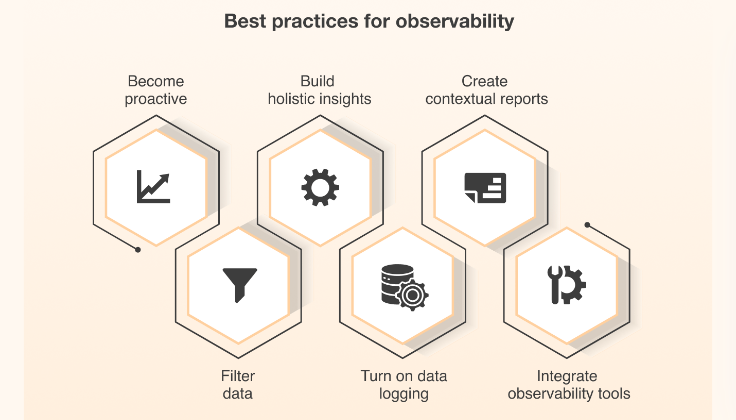
Source: Simform
Organizations need to implement full stack observability to leverage the benefits fully. Here’s a step-by-step guide to get started:
Step 1: Define Observability Objectives
Before diving into the technical implementation, it is crucial to define clear objectives. What do you want to achieve with full-stack observability? Common goals include reducing mean time to resolution (MTTR), improving application performance, and enhancing user experience. Having specific, measurable objectives will guide the implementation process.
Step 2: Choose the Right Tools
Selecting the appropriate tools is critical for effective full stack observability. Traditional domain-centric monitoring tools often face strain on their capabilities, highlighting the need to minimize reliance on manual processes by using full-stack observability to empower teams and improve performance. Numerous tools specialize in different aspects of observability, such as Prometheus for metrics, ELK Stack for logs, and Jaeger for tracing. Many platforms offer integrated solutions that combine metrics, logs and traces into a single pane of glass, providing unified observability.
Step 3: Instrument Your Applications
Instrumentation involves adding monitoring capabilities to your applications and infrastructure. This can be achieved through libraries, agents, or SDKs provided by observability tools. Ensure you instrument all stack layers, from the front to the back end, to capture comprehensive data.
Step 4: Set Up Alerts and Dashboards
Configuring alerts is vital for proactive issue detection. Gathering and correlating system data is essential to provide fuller visibility and understanding. Define thresholds for key metrics and set up alerts to notify relevant teams when these thresholds are breached. Additionally, create dashboards that visualize the collected data, making monitoring and analyzing system health in real time easier.
Step 5: Continuously Improve
Full stack observability is not a one-time effort. Continuously review and refine your observability practices based on the insights you gain. Update instrumentation regularly, revisit alert thresholds, and enhance dashboards to ensure they provide the most relevant information.
Real-World Use Cases of Full Stack Observability
Let’s explore some real-world use cases to further understand full-stack observability and its impact. Automated root cause analysis, powered by AI and visual aids, is crucial in quickly identifying the source of issues, allowing teams to focus on higher-order tasks.
E-commerce Websites
E-commerce platforms experience high traffic volumes, especially during peak seasons like Black Friday. Full stack observability enables these platforms to monitor performance across the entire stack, from user interactions on the website to backend payment processing systems. By identifying and addressing performance bottlenecks, e-commerce companies can ensure a seamless customer shopping experience.
Financial Services
Financial institutions rely heavily on the performance and reliability of their applications. Full stack observability helps these organizations adhere to strict regulatory requirements by providing detailed audit trails through logs and traces. Additionally, it aids in detecting fraudulent activities and minimizing downtime, which is critical for maintaining customer trust.
Healthcare Systems
In healthcare, application downtime can have severe consequences. Full stack observability empowers healthcare providers to monitor the performance and availability of critical systems, such as electronic health records (EHR) and telemedicine platforms. By ensuring the continuous operation of these systems, observability contributes to better patient care and outcomes.
Challenges and Best Practices
While full stack observability offers numerous benefits, it also presents some challenges. IT teams are crucial in integrating runtime application security and querying telemetry data to ensure seamless observability. Here are common obstacles and best practices for addressing them:
Data Overload
Collecting metrics, logs, and traces from every stack component can result in data overload. This data deluge can make it challenging for teams to parse through and find meaningful insights, potentially leading to missed critical issues or delays in identifying problems. Organizations should focus on collecting data that aligns with their specific observability objectives to manage this effectively. By prioritizing meaningful data, such as key performance indicators (KPIs) and business-critical metrics, teams can ensure they only monitor what truly matters.
This approach reduces the volume of data and makes it easier to identify patterns and anomalies that may indicate underlying issues. In addition to prioritizing meaningful data, sampling techniques can significantly mitigate data overload. Sampling involves capturing a subset of data points representative of the overall dataset, reducing the total amount of data collected without sacrificing the ability to detect trends and outliers.
Intelligent filtering further aids in managing data volume by automatically excluding redundant or non-essential information, allowing teams to concentrate on actionable insights. Combining these strategies with effective data aggregation and visualization tools can enhance the clarity and utility of the collected data, enabling quicker and more accurate decision-making.
Tool Integration
Integrating multiple observability tools can be complex, mainly when dealing with a diverse technology stack that includes various programming languages, frameworks, and infrastructure components. The lack of interoperability between different tools can lead to fragmented data, making gaining a comprehensive view of the system’s health difficult. Organizations should choose observability tools that offer seamless integrations with other essential tools in their tech stack to address this complexity.
Tools with built-in connectors and APIs can simplify the integration process, ensuring smooth data flow and reducing the manual effort required to correlate information from disparate sources. Moreover, opting for platforms that provide comprehensive observability solutions can further ease the burden of tool integration. These platforms typically combine metrics, logs, and traces into a unified interface, eliminating the need for multiple standalone tools.
For instance, integrated observability platforms like Datadog, New Relic, and Splunk offer a single-pane-of-glass view, making monitoring and analyzing the entire application stack easier. Utilizing such platforms simplifies the operational workflow and enhances the ability to detect and resolve issues promptly by providing holistic visibility into the system’s performance and health.
Security and Compliance

Ensuring the security and compliance of observability data is paramount, especially for industries with stringent regulatory requirements, such as finance and healthcare. Observability data often contains sensitive information, including user activity logs and transaction details, which can be targets for cyberattacks. Implementing robust access controls is crucial to protect this data. Role-based access controls (RBAC) ensure only authorized personnel can view and interact with sensitive information, minimizing the risk of unauthorized access and data breaches.
Additionally, enforcing strict authentication mechanisms, such as multi-factor authentication (MFA), adds an extra layer of security. Data encryption is another critical aspect of maintaining security and compliance. Encrypting observability data in transit and at rest protects it from interception and unauthorized access. Organizations should use industry-standard encryption protocols to ensure the highest level of data protection. Regular audits of observability practices are also essential to maintain compliance with regulatory standards.
Audits help identify potential security gaps and verify that observability processes align with organizational policies and regulations. Leveraging compliance-focused observability tools that offer features like audit logs, access tracking, and compliance reporting can facilitate easier management of regulatory requirements and ensure continuous adherence to security standards.
Continuous Training
Observability tools and practices evolve rapidly, and keeping your team updated on the latest advancements is crucial for maintaining effective observability. Regular training sessions and workshops can help team members stay abreast of new tools, features, and best practices, ensuring they are well-equipped to handle contemporary observability challenges. Hands-on training provides practical experience, allowing team members to apply new knowledge directly to their work.
Offering access to certification programs related to observability tools and methodologies can further validate skills and knowledge, fostering a culture of continuous learning and professional development. Encouraging knowledge sharing within the organization is another vital component of constant training. Creating forums, internal wikis, or chat channels where team members can share insights, tips, and experiences promotes peer learning and collaboration.
Participation in industry conferences, webinars, and meetups focused on observability also provides opportunities to learn from experts, network with peers, and stay informed about emerging trends. Adopting a mindset of continuous improvement by regularly reviewing and refining observability processes based on feedback and new learnings ensures that the organization remains agile and responsive to evolving observability needs.
Conclusion

In conclusion, understanding and effectively implementing full stack observability can significantly enhance modern applications’ performance, reliability, and security. By providing end-to-end visibility into all application stack layers, full stack observability empowers organizations to proactively detect and resolve issues, improve collaboration, and deliver superior user experiences. As the digital landscape evolves, embracing full stack observability will be a crucial strategy for staying ahead in the competitive market.
Do you need help with implementing full stack observability in your organization?